Proof, Not Promises: The Integration Work Behind Three Household Names
Every one of these started the same unglamorous way: data scattered across systems that didn't talk to each other before it became a dashboard anyone actually used.
Mahindra: Fragmented Reporting Into One Interactive View
Mahindra's teams were working across disparate systems and data silos, with no real-time, unified view for decision-making. Clay's own case study names both steps explicitly: Data Integration first, consolidating multiple sources into one model, then Self-Service Analytics, letting Mahindra's own people explore the data independently instead of waiting on a report, and replacing fragmented reporting with a single interactive view of business performance.
EIH: Financial Data Integration Before It Was a Dashboard
EIH's Customer Management team needed to walk into meetings with department heads already knowing hotel and department-level financials, not scrambling to assemble them beforehand. Clay's own delivery record names the first step explicitly: Data Integration — financial systems, sales data and operational data, integrated into Qlik Sense — before the five-minute pre-meeting dashboard check that followed ever existed.
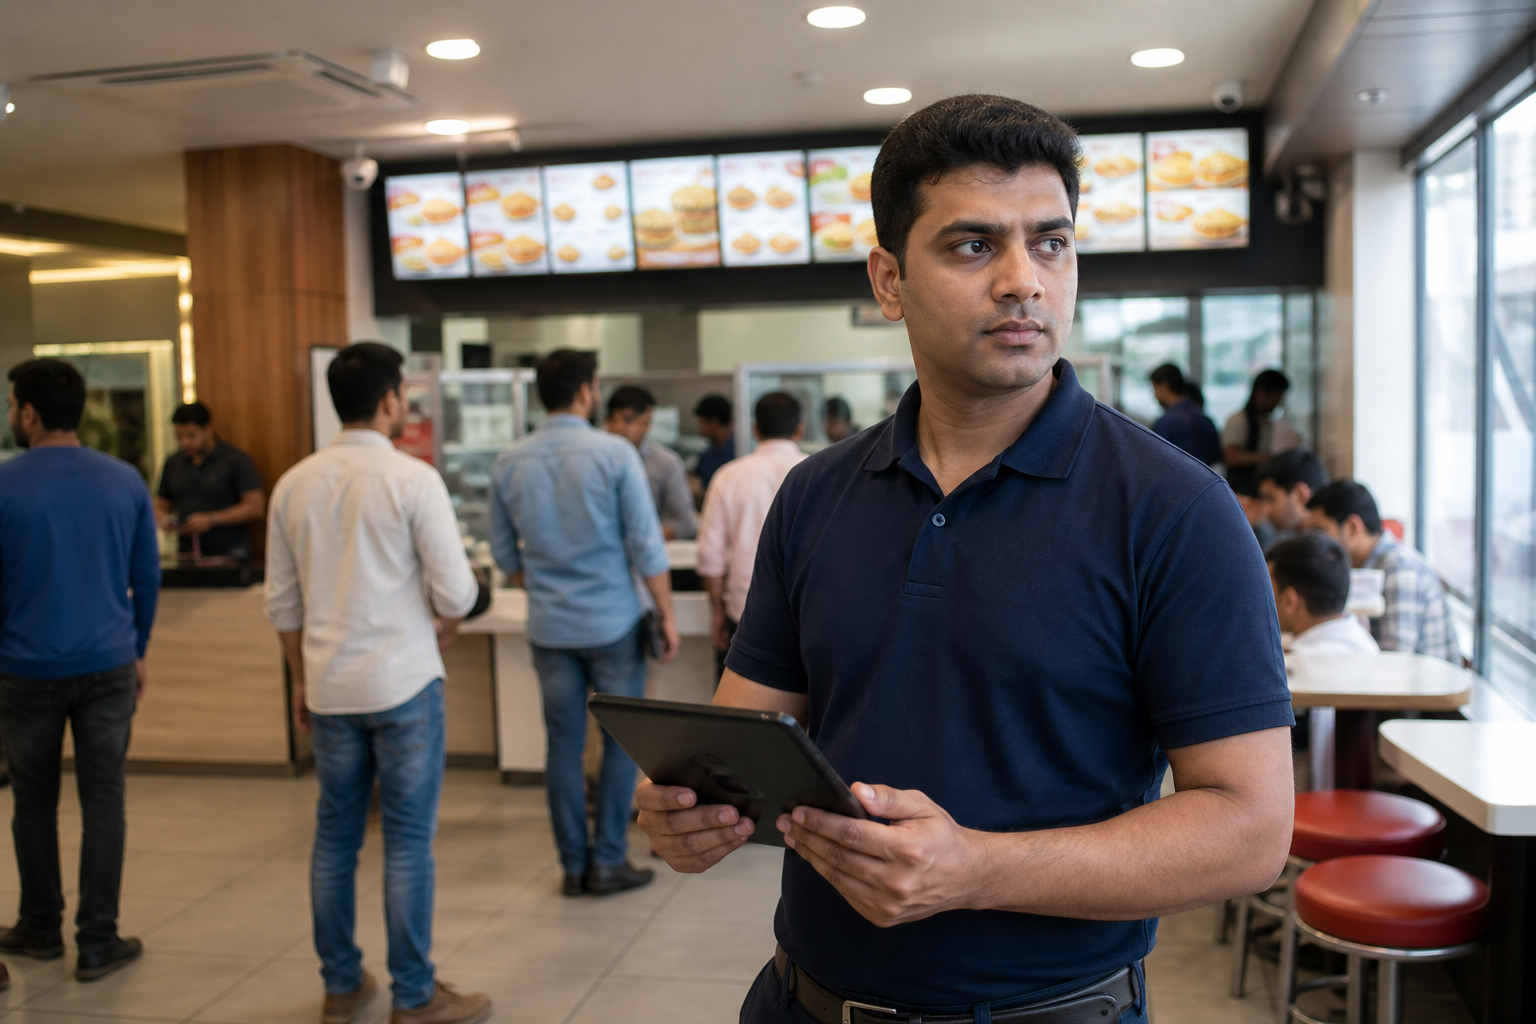
Burger King: Sales, Inventory and Operations, One Model
Territory managers needed store-level profit and loss visibility before every site visit, across a network too large to track manually. Clay combined Data Integration — sales, inventory and operational systems — into one Qlik Sense model.
If your Qlik dashboards feel unreliable, the fix is rarely the dashboard. It's usually Pillar One, the integration work underneath it, that never got done properly. Talk to our Qlik team about what you need.